
I am a self-taught programmer, and my formal education is in business. I remember when I start learning I was practicing a lot, doing a lot of various projects, and trying to do everything from scratch. I believe that the best way to learn anything is learning by doing. Facing challenges and solving them will help better understand things. So, this is a reason why I want to write few tutorials to help people learn new things.
This tutorial will be about data visualization with JavaScript. I already wrote a post where I was visualizing data via D3 library for Salesforce application. I was impressed by the IBM webinar, where they covered design-driven data visualization approach. So, I wanted to dive deeper into the topic.
In the first part, I will shortly explain some of the design-driven data visualization principles. We will define a problem, set of data to be visualized, and draw a mockup. In the following articles, we will build an Angular application along with a D3 library to solve the problem using learned techniques.
If you want to learn about design-driven principles, how to apply them, how to build interactive web application rather than the dashboard, this tutorial is for you.
Data Visualization
First of all, let’s mention what the data visualization is. If you read my previous article, you already know that it’s a presentation of the data in a pictorial or graphical format. Its primary goal is to communicate information clearly and efficiently.
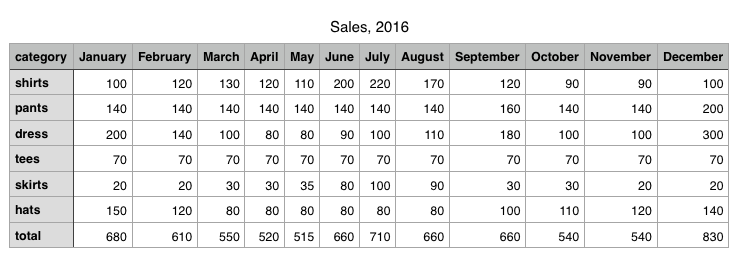
Consider this two representations of data from the previous post.
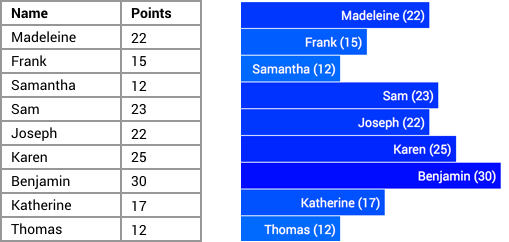
Try to spot the who has the highest amount of scores in a table. It is much clearer and easier to do in the visual form.
Graphical excellence is that which gives the viewer the greatest number of ideas in the shortest time with the least ink in the smallest space
This trait of visualizations is what makes them vital to businesses. (Principles of Data Visualization)
Design-Driven Principles
I will briefly introduce the fundamentals of a design-driven method to data visualization, which we will be using in this project. Otherwise, it could be a separate post to discuss this topic comprehensively. I highly recommend watching IBM webinar on this.
So, what are these principles of the design-driven approach on which we are going to focus?First of all, one of the design-driven information visualization traits is that it is people focused, not data or code. The main idea is that it should provide a better wayfinding, navigation complexity and offering insights.
Now let’s check in details how are we going to accomplish it.
Style
Let’s start with the color. There are three simple rules:
1. Same data – same color.
2. Complementary data – complementary color.
3. Contrast data – contrast color.
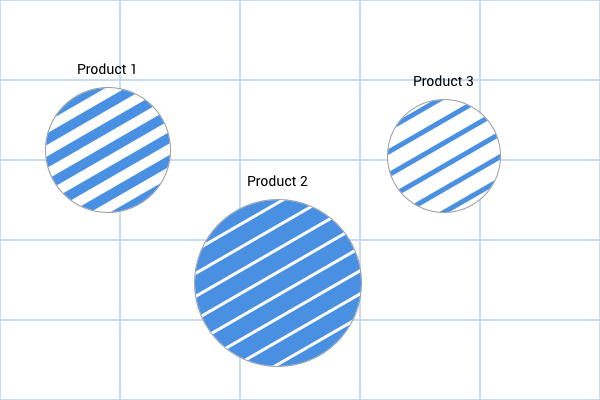
In our project, we will be using simple geometric shapes. Along with the animation, they might be very interactive, but the coolest thing is you can create different patterns of it. Combined with the color they might be very powerful.
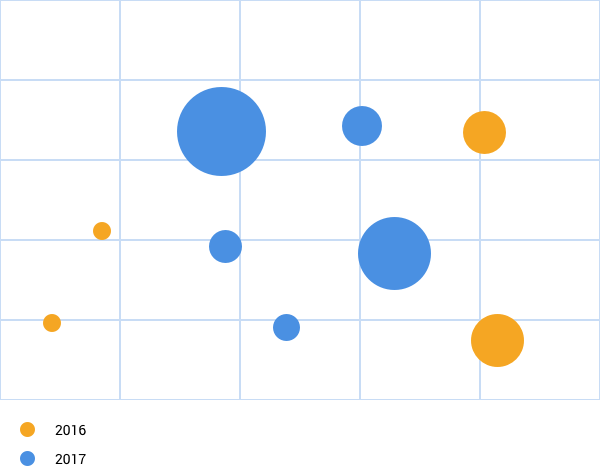
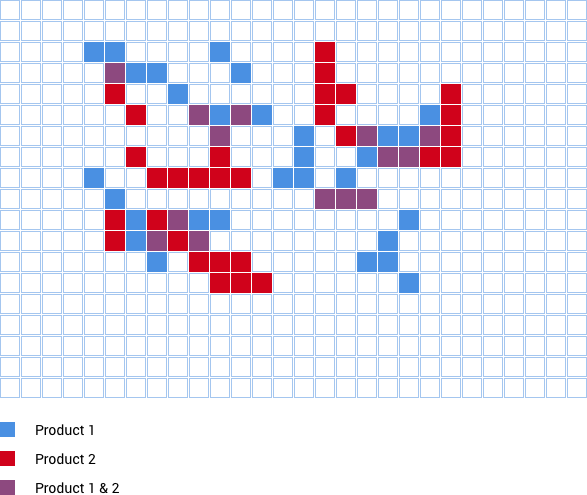
Overlapping is another useful method which can add a message of relationships to your diagram. For instance, in the following chart you can see where things co-occur.
One of the most important things is a grid. It highly increases a graph readability. It should always be clearly visible and don’t hide it.
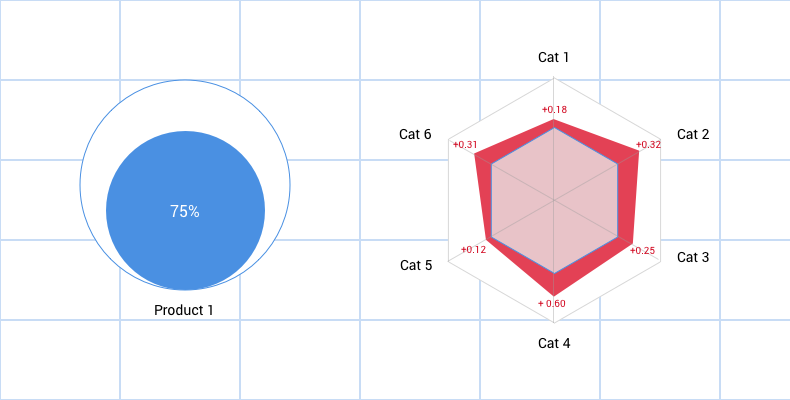
With the outline and solid relationship, you can define a focus of a chart. For instance, you can show the active status or correlation between current and previous / target states.
Interaction
Providing a control to a user is crucial. Here are the most common navigational patterns in data visualization:
- Overview first
- Zoom and filter. Helps to focus on a particular portion of a screen and reduce user confusion.
- Details on demand (Transition from the macro view to the micro view allowing the user to dig deep into the details).
The most crucial thing is to build environment rather than the dashboard. Once the user understands the space which you did, the analysis that they do rarely happens all at once. Manipulating filters is one of the fundamental means to look at a full dataset. By limiting the number of items in a view couples with possible real-time updates to the visualization you can allow rapid and reversible exploration of a data subsets.
This kind of environment is what we will build in this tutorial. Let’s face what are we going to visualize.
Project Overview
For this project, we have data representing an amount of monthly sales for the 2016 year by several product groups: apparel, toys, and tableware. Each of this product family consists of about six different categories. There is a CSV table for each of those products.
Our goal is to build an environment for the user, where he could quickly overview the current situation, use filters to narrow the dataset and dig deeper into the details if needed. So, in other words, we need to visualize data using design-driven principles.
This tutorial has a learning purpose so that some things would be simplified a bit.
I’ve started with sketching, on what chart types we could use to represent our data.
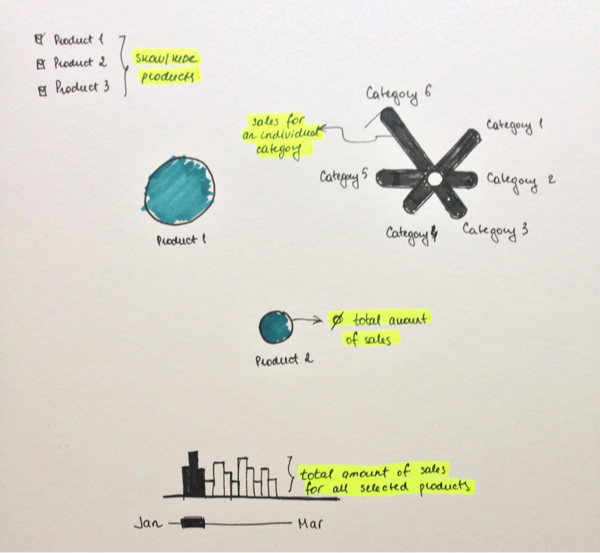
In the bottom, we would have an augmented slider so that users could use that to filter data in real time. It will represent a total amount of sales for selected products.
Then we will also have product filters, so the user could show and hide products in the diagram. Each circle will represent a product family, and its diameter depends on a total amount of sales for this product. It will help us create a relationship between products.
The user also will be allowed to click on a product circle to examine its details represented by flower chart. The length of the leaf represents an amount of sales for the individual category for the selected period.
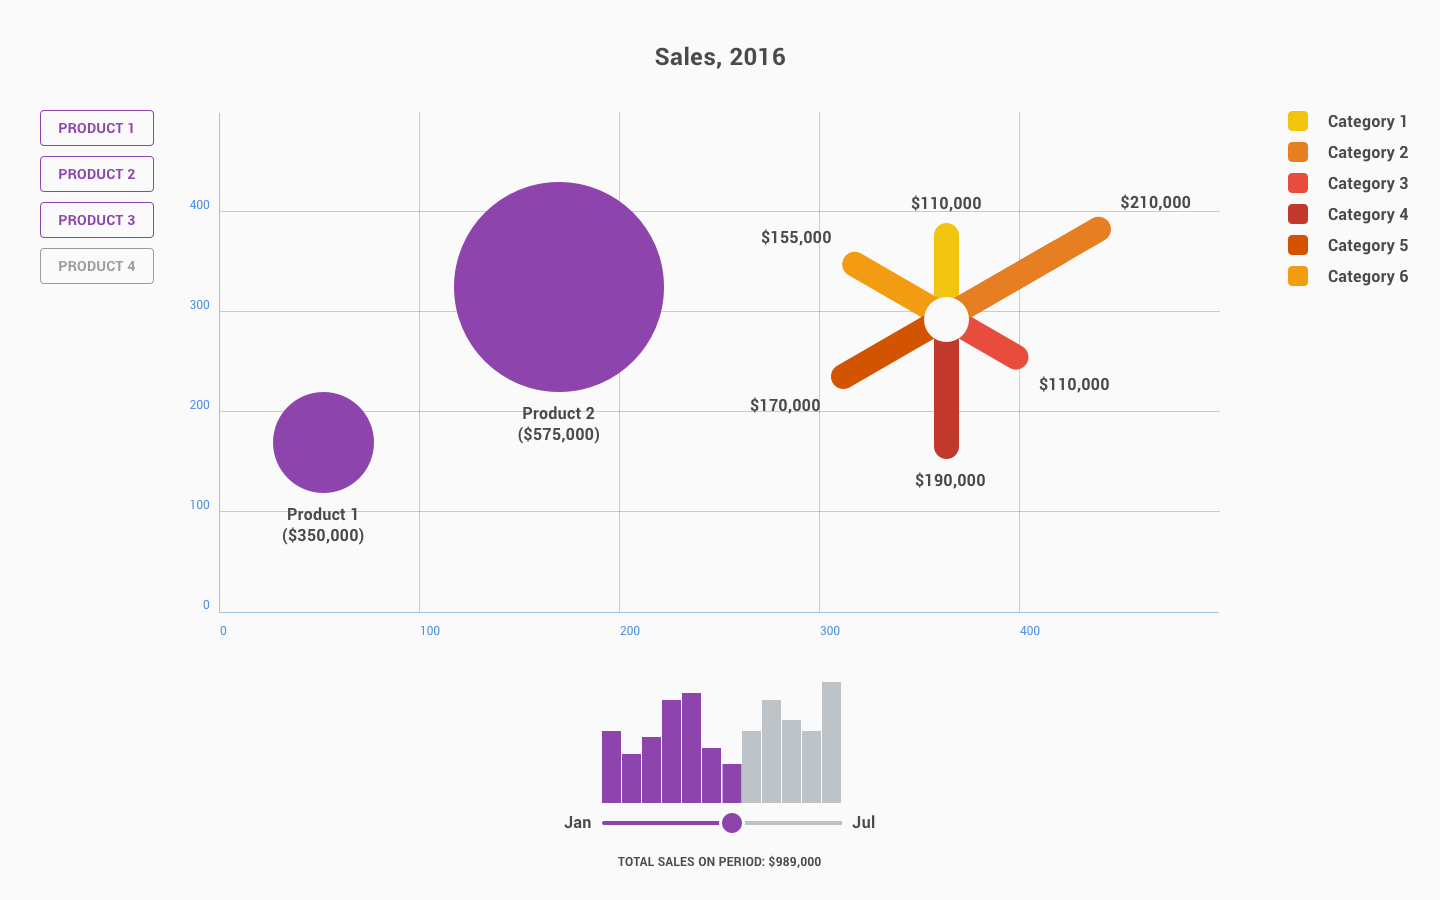
Based on this specification, I’ve drawn a design mockup of what we are going to build.
Summary
In the first post, we went throughout design-drive principles in data visualization and defined the problem. Now we have our data and know what we need to accomplish. So, we can continue with the technical stuff in the second part of this tutorial. Stay tuned!

Nikita Verkhoshintcev
Senior Salesforce Technical Architect & Developer
I'm a senior Salesforce technical architect and developer, specializing in Experience Cloud, managed packages, and custom implementations with AWS and Heroku. I have extensive front-end engineering experience and have worked as an independent contractor since 2016. My goal is to build highly interactive, efficient, and reliable systems within the Salesforce platform. Typically, companies contact me when a complex implementation is required. I'm always open to collaboration, so please don't hesitate to reach out!

